
Seaborn Color Palettes: Complete Guide to Data Visualization Colors
Seaborn Color Palettes: Complete Guide to Data Visualization Colors
Why color styling matters
Seaborn color palettesare predefined sets of colors that enhance your Python data visualizations by providing consistent, accessible, and visually appealing color schemes. These palettes help distinguish categories, emphasize patterns, and improve the readability of your charts. Whether you’re working with categorical data, sequential values, or diverging datasets, choosing the right Seaborn color palette can transform basic plots into compelling visual stories that communicate insights effectively.
Creating Seaborn color palettes
A Seaborn color palette defines the colors used in your plots and can be created using thesns.color_palette()function. This function accepts any of the built-in Seaborn palettes, such as"deep","muted", or"bright". These seaborn color palettes provide consistent styling across your Python data visualizations.
You can also customize your palette by passing a list of colors in any valid Matplotlib format. This includes RGB tuples, hex color codes, or HTML color names, giving you full control over the visual style of your plots.
If you want to preview how a Seaborn color palette will appear, use thesns.palplot()function to display the palette as a row of colors. An example of this is as follows:
# Save a palette to a variable:palette = sns.color_palette("bright")    # Use palplot and pass in the variable:sns.palplot(palette)
Copy to clipboard
# Save a palette to a variable:palette = sns.color_palette("bright") # Use palplot and pass in the variable:sns.palplot(palette)
image1
To select and set a palette in Seaborn, use the commandsns.set_palette()and pass in the name of the palette that you would like to use:
# Set the palette using the name of a palette:sns.set_palette("Paired")    # Plot a chart:sns.stripplot(x="day", y="total_bill", data=tips)
Copy to clipboard
# Set the palette using the name of a palette:sns.set_palette("Paired") # Plot a chart:sns.stripplot(x="day", y="total_bill", data=tips)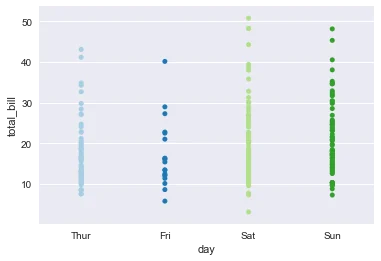
image2
Before customizing your palettes, it’s helpful to understand the default Seaborn color palette and how it improves over traditional Matplotlib colors.
Seaborn default color palette
If you don’t specify a seaborn color palette usingsns.color_palette()orsns.set_palette(), Seaborn automatically applies its default palette. This palette is designed to be more visually appealing and accessible than the standard Matplotlib colors, which is one of the reasons many data analysts and scientists prefer Seaborn.
Here’s a comparison between Matplotlib’s default palette and Seaborn’s improved default:
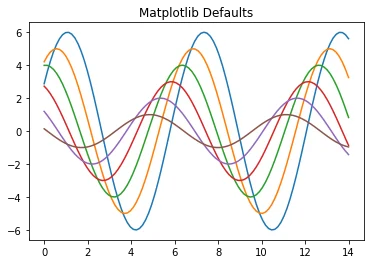
image3
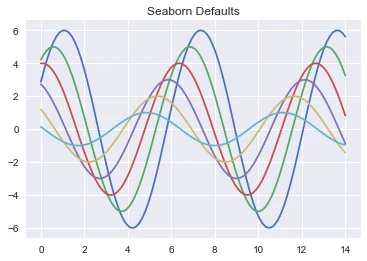
image4
As you can see, Matplotlib’s default color palette uses basic, less coordinated colors on a white background. However, Seaborn’s default styling features softer, more visually appealing colors along with a gray grid background that improves readability and contrast.
Seaborn has six variations of its default color palette:deep,muted,pastel,bright,dark, andcolorblind.
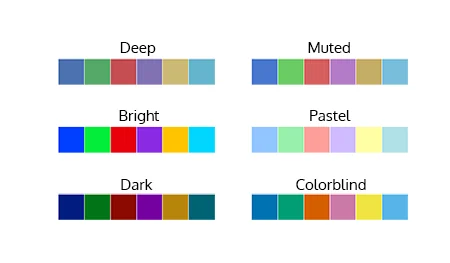
image6
To use one of these palettes, pass the name intosns.set_palette():
# Set the palette to the "pastel" default palette:sns.set_palette("pastel")    # plot using the "pastel" palettesns.stripplot(x="day", y="total_bill", data=tips)
Copy to clipboard
# Set the palette to the "pastel" default palette:sns.set_palette("pastel") # plot using the "pastel" palettesns.stripplot(x="day", y="total_bill", data=tips)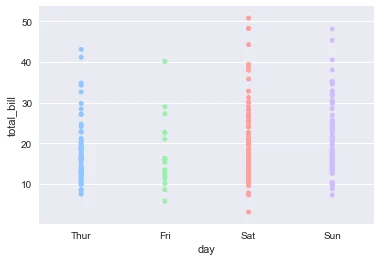
image7
But can you apply Seaborn’s styling to standard Matplotlib charts?
Applying Seaborn to Matplotlib
Seaborn’s styling features aren’t limited to Seaborn-specific plots. You can also apply its color palettes and themes to standard Matplotlib charts, like histograms or scatter plots. This is done using thesns.set()function, which globally updates the plot aesthetics.
For example, to style Matplotlib’splt.hist()with Seaborn’s default colors:
# Call the sns.set() function sns.set()for col in 'xy':  plt.hist(data[col], normed=True, alpha=0.5)
Copy to clipboard
# Call the sns.set() function sns.set()for col in 'xy': plt.hist(data[col], normed=True, alpha=0.5)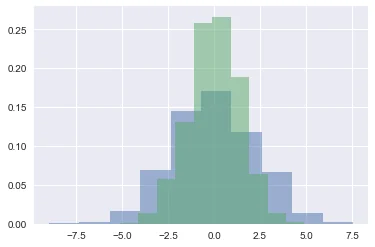
image5
Usingsns.set()not only applies the Seaborn default color palette but also enables its grid style, font scaling, and other formatting enhancements.
Seaborn also supports Color Brewer palettes, which offer more options for clear and accessible color styling.
Using Color Brewer palettes
In addition to the default palette and its variations, Seaborn also allows the use of Color Brewer palettes.Color Breweris the name of a set of color palettes inspired by the research of cartographer Cindy Brewer. The color palettes are specifically chosen to be easy to interpret when used to represent ordered categories. They are also colorblind accessible, as each color differs from its neighbors in lightness or tint.
To use, pass the name of any Color Brewer palette directly to any of the color functions. These palettes expand your seaborn color palette options beyond the default choices:
custom_palette = sns.color_palette("Paired", 9)sns.palplot(custom_palette)
Copy to clipboard
custom_palette = sns.color_palette("Paired", 9)sns.palplot(custom_palette)
image8
Here is a list of the Color Brewer palettes, with their names for easy reference:
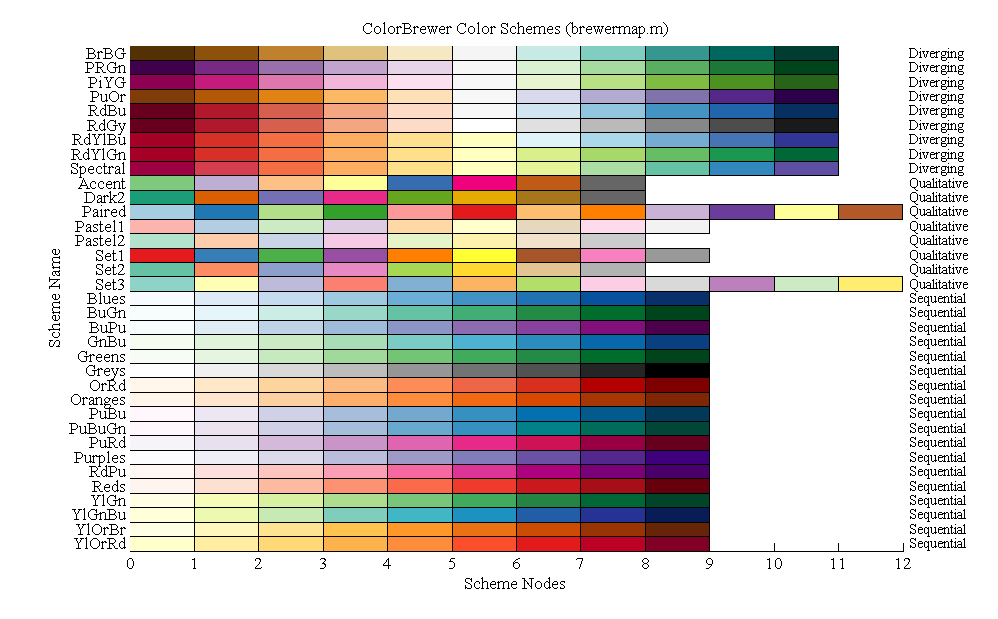
image9
Check out theColor Brewerwebsite for more information about color palette configuration options.
With so many palette options available, the key is knowing which one fits your data best. Let’s break down how to match color palettes to different types of datasets.
Choosing the right color palette
Not all datasets are created equal, and the colors you choose should reflect the type of data you’re working with. Seaborn offers different palette types tailored for specific data structures, helping you highlight patterns more effectively.
Qualitative Palettes for Categorical Datasets
When using a dataset that uses distinct but non-ordered categories, it’s good to use qualitative palettes. Qualitative palettes are sets of distinct colors which make it easy to distinguish the categories when plotted, but don’t imply any particular ordering or meaning.
An example of categorical data is the breed of dog. Each of these values, such as Border Collie or Poodle, are distinct from each other but there isn’t any inherent order to these categories.
Here’s an example of a qualitative Color Brewer palette:
qualitative_colors = sns.color_palette("Set3", 10)sns.palplot(qualitative_colors)
Copy to clipboard
qualitative_colors = sns.color_palette("Set3", 10)sns.palplot(qualitative_colors)
image10
Sequential palettes for ordered data
Just as the name implies, sequential palettes are a set of colors that move sequentially from a lighter to a darker color. Sequential color palettes are appropriate when a variable exists as ordered categories, such as grade in school, or as continuous values that can be put into groups, such as yearly income. Because the darkest colors will attract the most visual attention, sequential palettes are most useful when only high values need to be emphasized.
Here’s an example of a sequential Color Brewer palette:
sequential_colors = sns.color_palette("RdPu", 10)sns.palplot(sequential_colors)
Copy to clipboard
sequential_colors = sns.color_palette("RdPu", 10)sns.palplot(sequential_colors)
image11
Visualizing data with diverging palettes
Diverging palettes are best suited for datasets where both the low and high values might be of equal interest, such as hot and cold temperatures.
In the example here, both ends of the spectrum — fire red and deep blue — are likely to attract attention.
diverging_colors = sns.color_palette("RdBu", 10)sns.palplot(diverging_colors)
Copy to clipboard
diverging_colors = sns.color_palette("RdBu", 10)sns.palplot(diverging_colors)
image12
Here is a quick diagram that depicts each of the palette types:
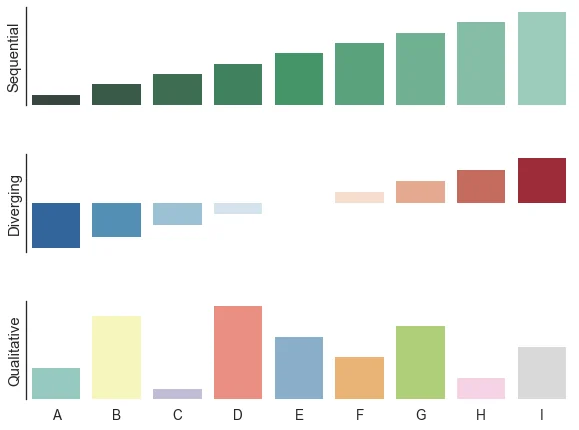
image13
Conclusion
Color plays a powerful role in data visualization, and Seaborn makes it easy to apply thoughtful color choices through its wide range of built-in and customizable palettes. From understanding the default palette to exploring Color Brewer options and choosing the right palette for your dataset, styling with color helps make your charts more effective, accessible, and visually engaging.
To continue building your skills in data visualization with Python, check out Codecademy’sVisualize Data with Pythoncourse.
Frequently asked questions
1. What is the default color palette in Seaborn?
Seaborn uses the"deep"palette as its default color palette. This palette provides six visually distinct and colorblind-friendly colors.
2. How do I change the color of my Seaborn heatmap?
To change the color scheme of a Seaborn heatmap, use thecmapparameter:
sns.heatmap(data, cmap="YlGnBu")
Copy to clipboard
sns.heatmap(data, cmap="YlGnBu")You can choose any Matplotlib-compatible colormap name like"coolwarm","viridis", or"Blues"to suit your data’s tone and purpose.
3. What are the best color palettes for categorical data?
Qualitative palettes likeSet1,Set2, andPairedfrom Color Brewer are ideal for categorical data with distinct but unordered categories.
4. What are the colors of Seaborn?
Seaborn includes six built-in palette variations, which aredeep,muted,pastel,bright,dark, andcolorblind
'The Codecademy Team, composed of experienced educators and tech experts, is dedicated to making tech skills accessible to all. We empower learners worldwide with expert-reviewed content that develops and enhances the technical skills needed to advance and succeed in their careers.'
Complete Payment to Unlock Full Guide & Source Code
You are viewing the 30% preview. Join TopCourseAI Pro to unlock the remaining 70% of this article, unblur all code snippets, and gain full access to all 412 technical projects and guides.
Ready to access the complete step-by-step tutorial?
Gain full unhindered access to all 412 technical projects and guides, unblur all source code snippets, and download runnable scripts.
Scikit-Learn Tutorial: Python Machine Learning Model Building
Next BlueprintSeaborn Styling, Part 1: Figure Style and Scale
Related Blueprints & Guides
View all 166 →CSS Glossary
Comments in CSS are signified by a forward-slash and asterisk.
Web designInline Styles in HTML
Usually, CSS is written in a separate CSS file (with file extension.css) or in a<style>tag inside of the<head>tag, but there is a third place which is also valid. The third place you can write CSS is inside of an HTML ta...
Web designManaging Assets and Icons
In this article, you will learn how to manage icons and assets using web-based tools.
Ready to build production-grade AI systems?
Enjoyed this guide? Continue exploring our library of 166+ production blueprints, multi-agent swarms, and autonomous agent systems with 100% unblurred, executable source code.