
Running JavaScript in the Browser Console
Running JavaScript in the Browser Console
Along with HTML and CSS,JavaScript(JS) makes up one of the core languages inweb development. JS code is normally added using the HTML<script>element for executing in web browsers, but most modern browsers also provide a console as part of their developer tools where we can directly write and run JS, typically for testing and debugging purposes. The console is essentially a REPL (Read-Evaluate-Print-Loop) that allows us to execute JS within the context of the page, such as modifying the page’sDOM (Document Object Model)or logging to the console. The console itself is also the place to view the messages that were logged by JS code, as well as any other information that the browser had documented, including network requests and security errors.
In this article, we’ll walk through how to open the developer console and run JS code right in your browser!
Opening the browser console
The steps to opening the console may be slightly different depending on the browser you use as well as your computer’s operating system. But generally, you should be able to bring up the developer tools by right clicking and selectingInspectorInspect Element, and then navigate to theConsoletab from there. (If you are using Apple Safari, you will first need to go to yourPreferencesand check the “Show Develop menu in menu bar” option under theAdvancedtab.) Below are some alternative ways of bringing up the console:
- Google ChromeMacCmd+Opt+JView>Developer>JavaScript ConsoleWindowsCtrl+Shift+JCustomize and control Google Chrome(3-vertical-dot icon⋮) >More tools>Developer tools, then clickConsoletab
- Mozilla FirefoxMacCmd+Opt+KTools>Web Developer>Web ConsoleWindowsCtrl+Shift+KOpen menu (3-bar icon☰) >Web Developer>Web Console
- Microsoft EdgeMacCmd+Opt+JTools>Developer>JavaScript ConsoleWindowsSettings and more(3-dot icon⋯) >More tools>Developer tools, then clickConsoletab
- Apple SafariMacCmd+Opt+CDevelop>Show JavaScript Console
We’ll be using Google Chrome for the following examples — also, feel free to try to follow along with the examples! When you pull up the console, you might see some messages that have been logged by the browser, depending on what site you’re on. If you do, feel free to runclear()first to clear the console.
Example #1: Performing basic arithmetic
Remember that the console is a REPL, so we can run JS code, such as arithmetic expressions, by typing it after the>prompt and hittingEnter/Return. The expression will be evaluated, and the return value is printed to the console on the next line following the<arrow:
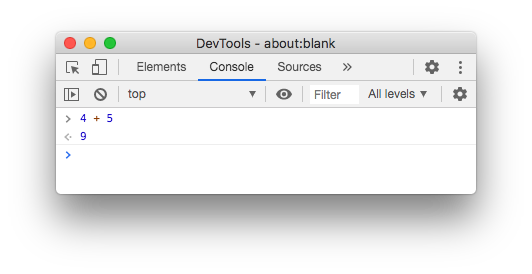
basic_arithmetic
Similarly, we can use comparison operators to compare values, which will evaluate totrueorfalse:
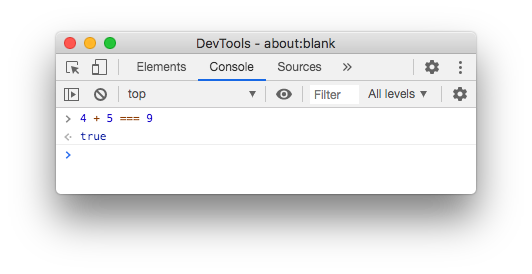
expression_evaluation
In some newer browsers, you may notice that the console displays a preview of the return value as you’re typing, even before you hitEnter/Return.
Example #2: Calling and writing functions
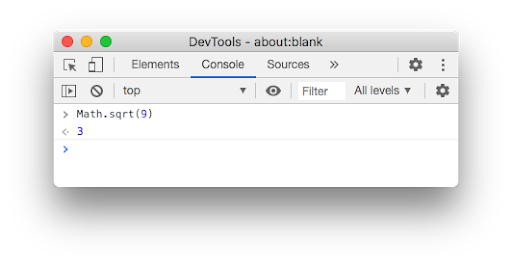
In addition to performing basic arithmetic, we can also execute any other valid JS code, such as calling functions and methods. A list of the built-in functions and objects that are available to use in the console can be found in theMDN web docs. For example,Math.sqrt()returns the square root of a number:
calling_methods
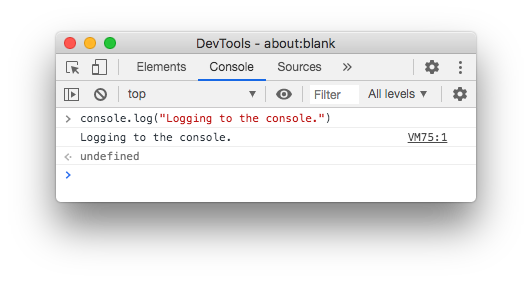
Theconsoleobjectcan also be accessed in the web browser’s console. Most frequently, it is used to output text and data, such as for debugging purposes:
console_logging
Notice that two new lines appear after running the previous code, one preceded by the<arrow and one without. This is becauseconsole.log()simply prints the message to the console and does not return anything. Thus, the first line we see is the logged message, and the second line that starts with<is the return value, orundefined.
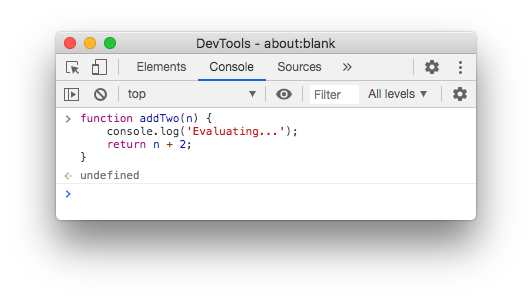
We can also write our own functions in the console. In the example below, we define a function calledaddTwo()which logs a message to the console, then returns the input number plus2:
defining_functions
Because the function declaration itself does not evaluate to any value,undefinedis returned and printed to the console after the<arrow.
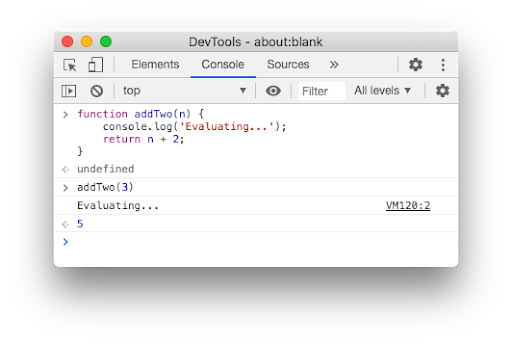
When we call theaddTwo()function,Evaluating...is first outputted to the console from ourconsole.log()call. Then, the function’s return value—which is what the function call evaluates to—will get printed after the<arrow:
calling_function
Example #3: Interacting with the page’s DOM
As we’ve seen so far, we can run JS in the console completely independent of the page we have opened in the browser. But what makes the console particularly useful is that we could also directly inspect and modify the page’s DOM if we wanted to. Let’s look at a simple example using a blank webpage.
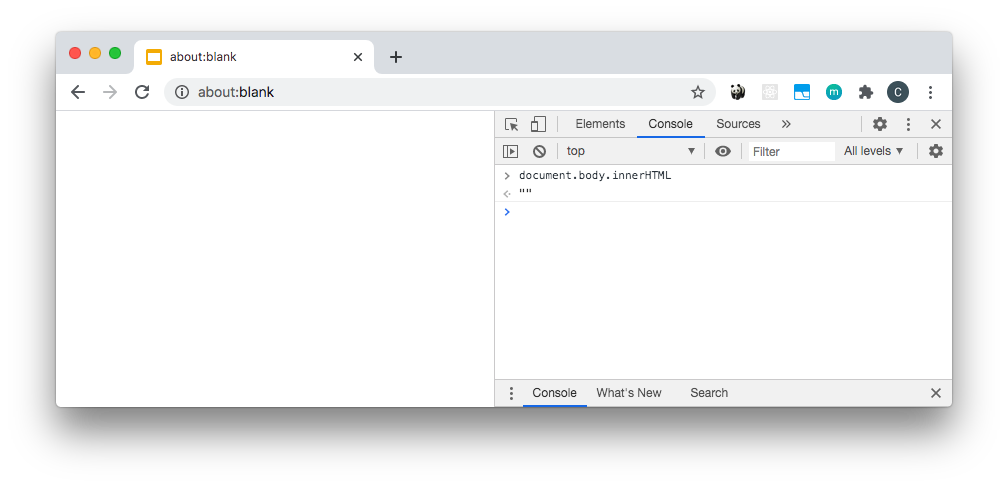
To bring up a blank page, we can enterabout:blankinto the browser’s address bar. We can confirm that there is no HTML inside the<body>element of the page by checkingdocument.body.innerHTMLin the console:
inspecting_body
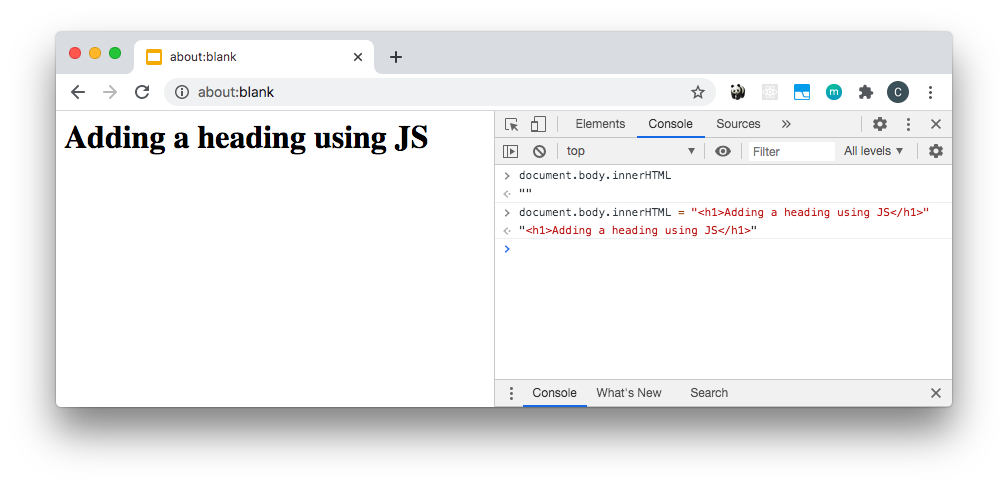
We can also write JS code to modify the page’s DOM, such as adding a heading element inside the body, as seen below. Once we run the following code, the change will immediately be reflected on the page opened in the browser:
manipulating_body
The console also recognizes$()as an alias fordocument.querySelector()to select an element. This shorthand resemblesjQuerysyntax and helps make manipulating the DOM through the console even more efficient:
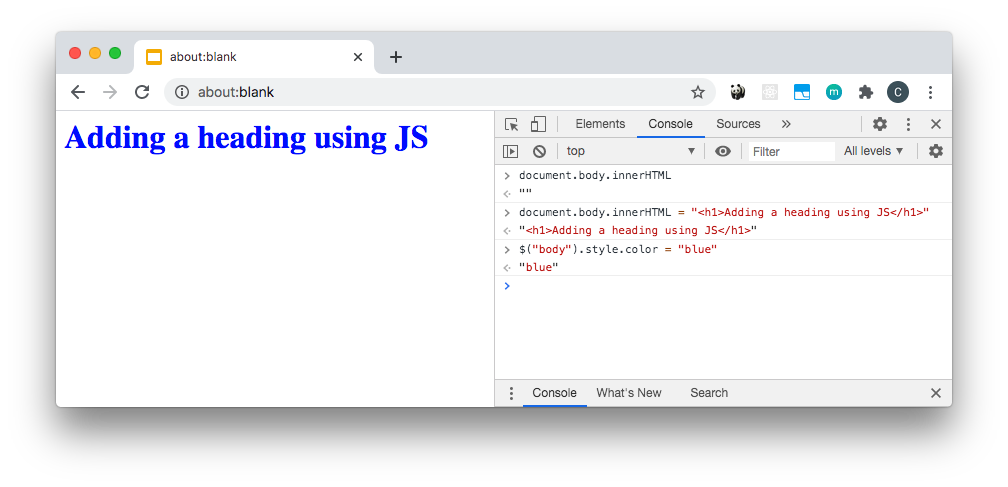
aliasing_dom_selector
In the code above, we used the shorthand$()syntax to select the<body>element and set thecolorproperty to"blue". This statement returns the value"blue"to the console, and the color change is immediately reflected on the webpage.
Conclusion
As we can see, the console provides a quick and convenient way of running any JS code in the browser, whether independent of or directly related to the page content. If any edits are made to the page, the changes are temporary and will be gone upon refreshing, which works great for testing purposes when you don’t want to modify the actual code. Combined with the other developer tools offered by browsers, we can see how the console can quickly become an essential part of a developer’s toolbox!
'The Codecademy Team, composed of experienced educators and tech experts, is dedicated to making tech skills accessible to all. We empower learners worldwide with expert-reviewed content that develops and enhances the technical skills needed to advance and succeed in their careers.'
Complete Payment to Unlock Full Guide & Source Code
You are viewing the 30% preview. Join TopCourseAI Pro to unlock the remaining 70% of this article, unblur all code snippets, and gain full access to all 412 technical projects and guides.
Ready to access the complete step-by-step tutorial?
Gain full unhindered access to all 412 technical projects and guides, unblur all source code snippets, and download runnable scripts.
Running Hello World Locally (Xcode & Terminal)
Next BlueprintRunning Tests and Interpreting Output with Mocha and Chai
Related Blueprints & Guides
View all 166 →Accessibility on the Platform
Codecademy is committed to providing a high-quality learning experience for all learners. That includes accommodating different usage forms such as auditory, motor, or visual restrictions, limited hardware, or other acce...
Web developmentAffordances, Signifiers, and Clickability
For users on the web, the mouse click is perhaps the most fundamental human-computer interaction. The webbecamethe web partially through the power ofhypertext, or text in one document that links to other documents or res...
Web developmentAuthentication and OAuth
Authenticationis the process used by applications to determine and confirm identities of users. It ensures that the correct content is shown to users. More importantly, it ensures that incorrect content is secured and u...
Ready to build production-grade AI systems?
Enjoyed this guide? Continue exploring our library of 166+ production blueprints, multi-agent swarms, and autonomous agent systems with 100% unblurred, executable source code.