
Normalization: Min-Max and Z-Score Normalization
Normalization: Min-Max and Z-Score Normalization
What is normalization?
Normalizationis a useful data preprocessing technique used to adjust the scale of numeric data features so that they fall within a particular range or follow a specific distribution. This is especially important when datasets contain features with widely varying scales, as normalizing data helps create uniformity across features. It transforms values in a dataset into a common scale, which ensures that no single feature dominates others due to its magnitude. Without normalization,machine learningalgorithms can become biased toward features with larger values, resulting in skewed predictions or inefficient training.
There are several techniques for normalizing data, but the most commonly used ones are:
- Min-max normalization
- Z-score normalization
Let’s explore each of these techniques in detail, starting with min-max normalization.
What is min-max normalization?
Min-max normalization (also called max-min normalization) is one of the most common ways of normalizing data. For every feature, the minimum value of that feature gets transformed into a 0, the maximum value gets transformed into a 1, and every other value gets transformed into a decimal between 0 and 1.
For example, if the minimum value of a feature was 20 and the maximum value was 40, then 30 would be transformed to exactly 0.5 since it is halfway between 20 and 40. The max-min normalization formula is:
value−minmax−min\frac{value - min}{max - min}
max−minvalue−minMin-max normalization has one fairly significant downside: it does not handle outliers very well. For example, if you have 99 values between 0 and 40, and one value is 100, then the 99 values will all be transformed to a value between 0 and 0.4. That data is just as squished as before. Take a look at the image to see an example of this scenario:
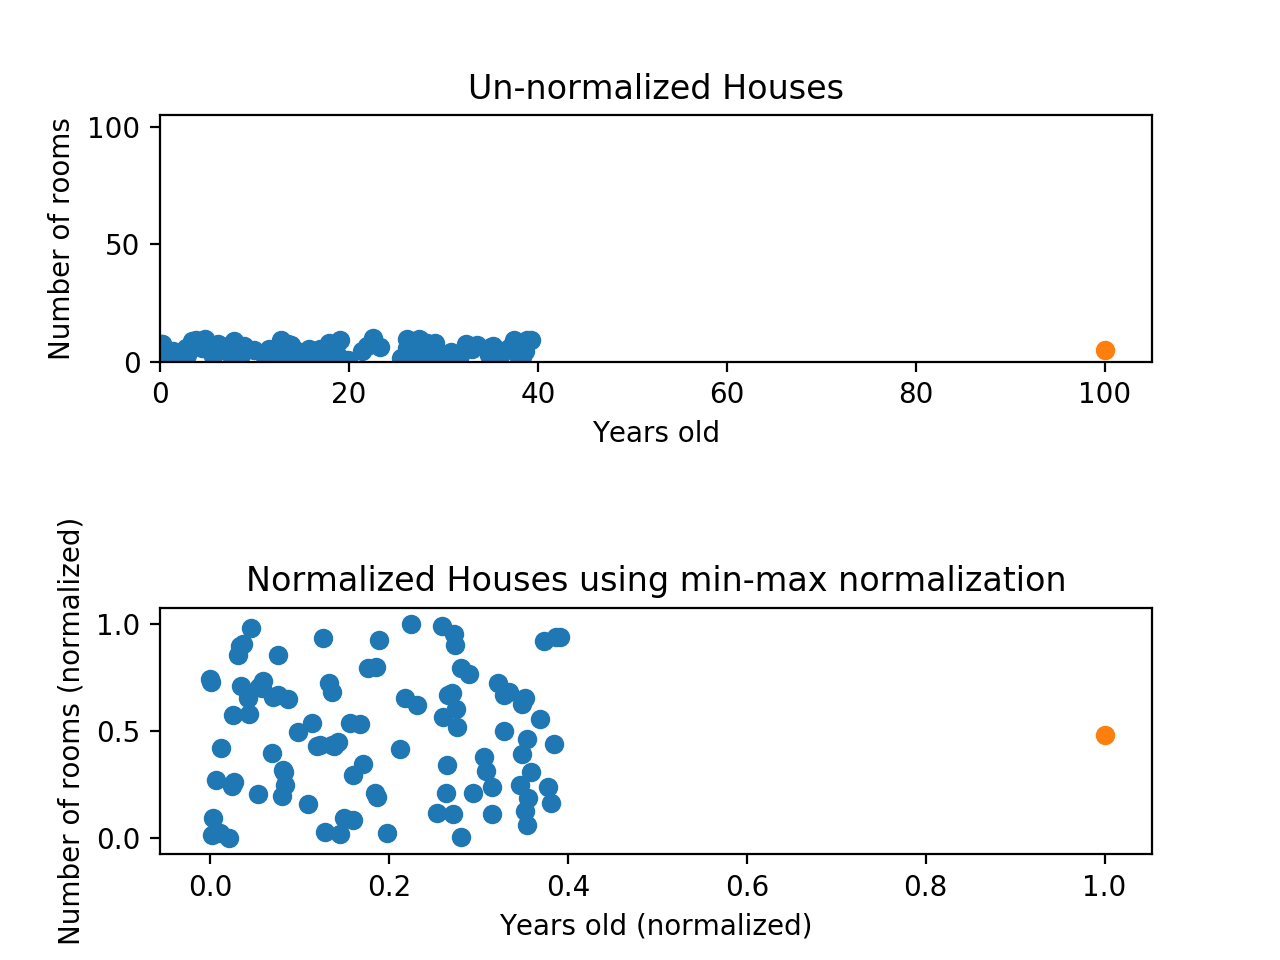
A min-max normalization example where almost all normalized data points have an x value between 0 and 0.4
Normalizing data fixed the squishing problem on the y-axis, but the x-axis is still problematic. Now, if we were to compare these points, the y-axis would dominate; the y-axis can differ by 1, but the x-axis can only differ by 0.4.
Now that we’ve got an idea about min-max normalization, let’s move forward and discuss z-score normalization.
What is z-score normalization?
Z-score normalization (or z-score standardization) is a strategy of normalizing data that avoids this outlier issue. The z-score normalization formula is:
value−μσ\frac{value - \mu}{\sigma}
σvalue−μHere, μ is the mean value of the feature, and σ is the standard deviation of the feature. If a value is exactly equal to the mean of all the values of the feature, it will be normalized to 0. If it is below the mean, it will be a negative number, and if it is above the mean, it will be a positive number. The size of those negative and positive numbers is determined by the standard deviation of the original feature. If the unnormalized data had a large standard deviation, the normalized values would be closer to 0.
The graph shows the same data using z-score normalization:
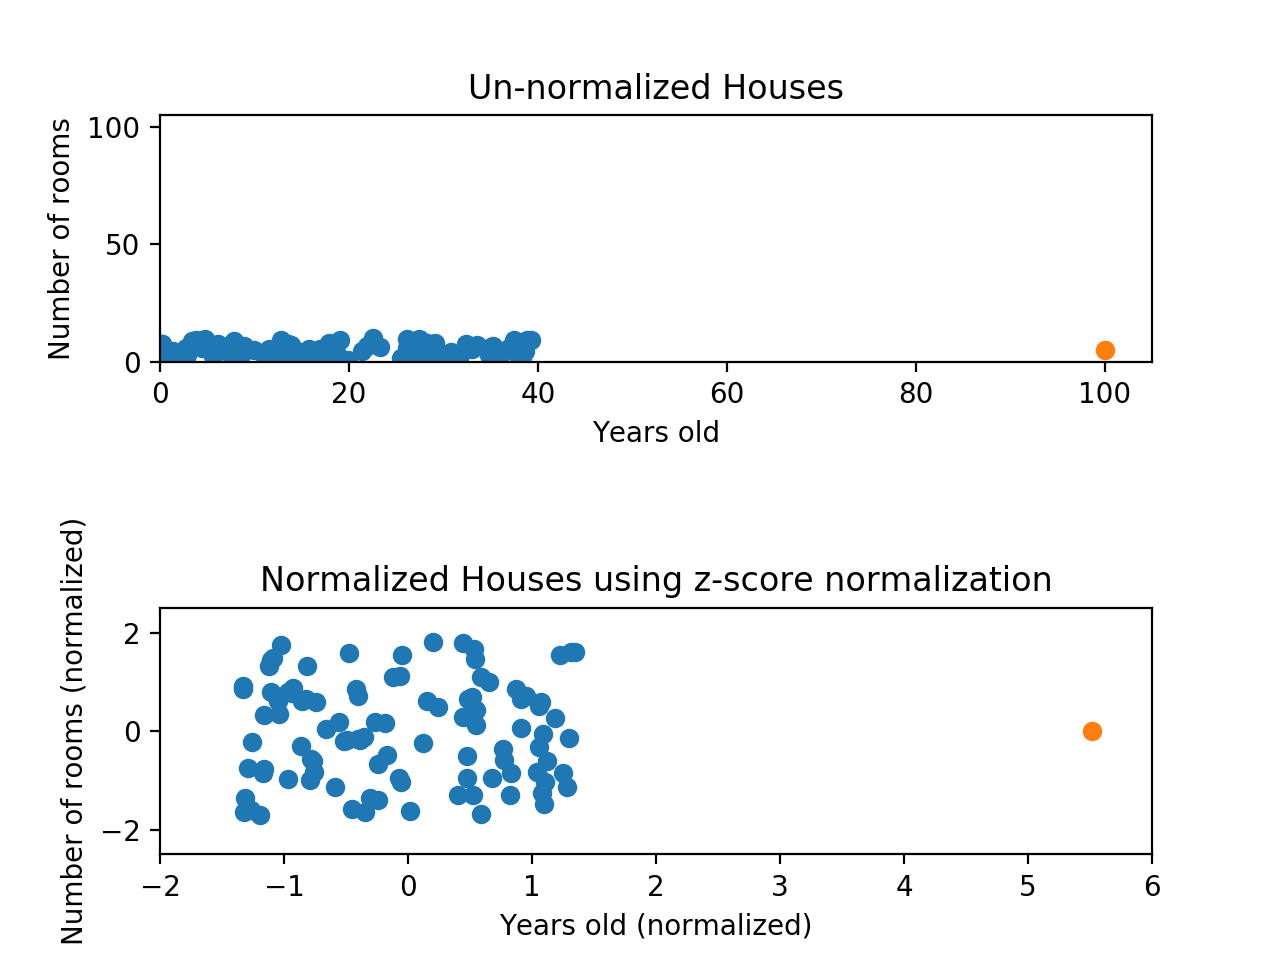
A z-score normalization example where all points have a similar range in both the x and y dimensions
While the data still looks squished, observe that the points are now on roughly the same scale for both features — almost all points are between -2 and 2 on both the x-axis and y-axis. The only potential downside is that the features aren’t on the exact same scale.
With min-max normalization, we were guaranteed to reshape both of our features to be between 0 and 1. Using z-score normalization, the x-axis now has a range from about -1.5 to 1.5, while the y-axis has a range from about -2 to 2. This is certainly better than before; the x-axis, which previously had a range of 0 to 40, is no longer dominating the y-axis.
With min-max normalization and z-score normalization covered, let’s go through the differences between normalization and standardization.
Normalization vs. standardization
Here are the differences between normalization and standardization:
Next, let’s discuss why we should normalize data in machine learning.
Why normalize data?
Many machine learning algorithms attempt to find trends in data by comparing features of data points. However, there is an issue when the features are on drastically different scales.
For example, consider a dataset of houses. Two potential features might be the number of rooms in the house and the total age of the house in years. A machine learning algorithm could try to predict which house would be best for you. However, when the algorithm compares data points, the feature with the larger scale will completely dominate the other. Take a look at this image:
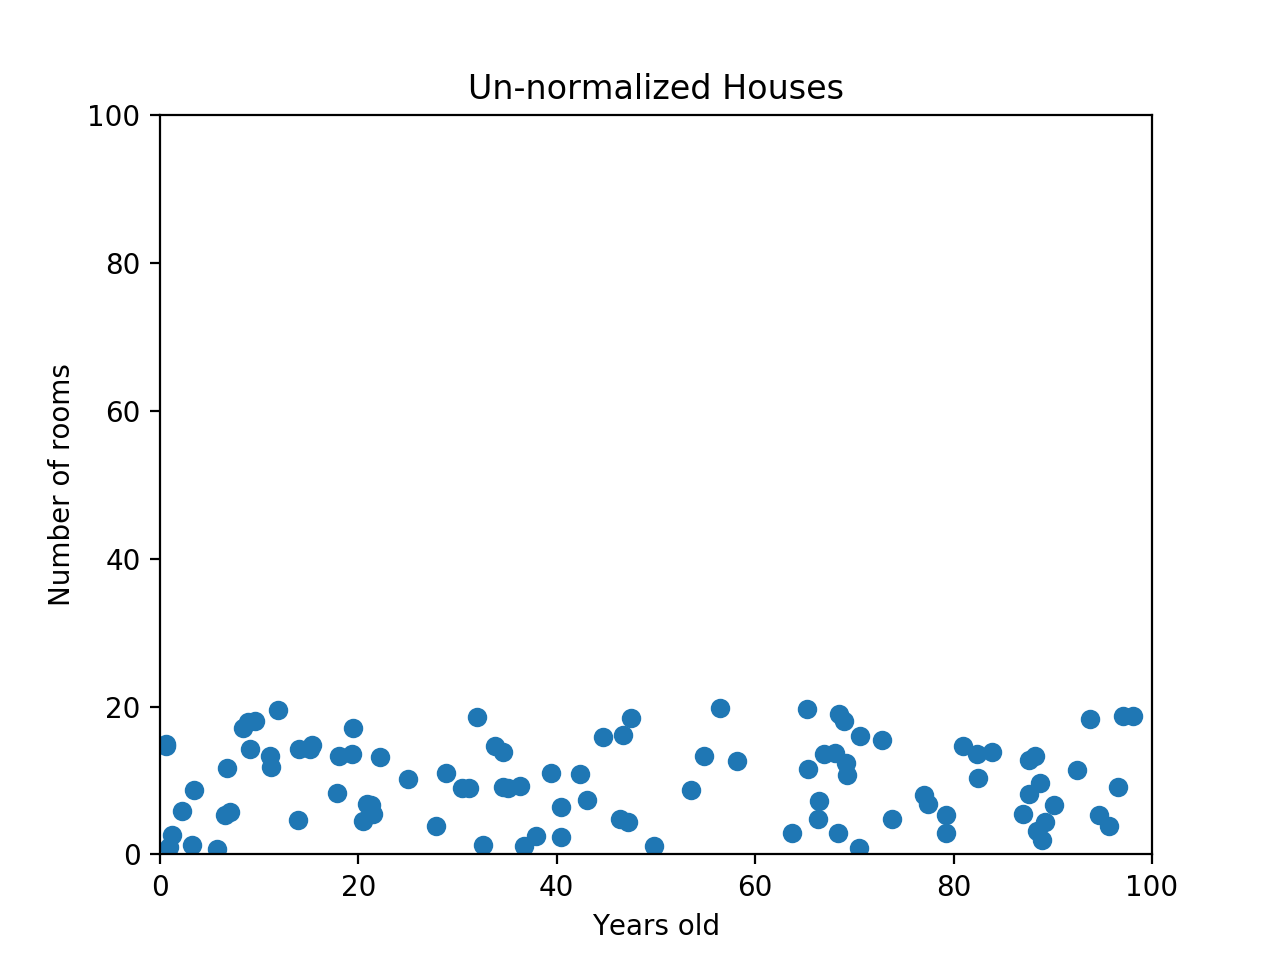
Data points on the y-axis range from 0 to 20 and data points on the x-axis range from 0 to 100
When the data looks squished like that, we know we have a problem. The machine learning algorithm should realize that there is a huge difference between a house with 2 rooms and a house with 20 rooms. But right now, because two houses can be 100 years apart, the difference in the number of rooms contributes less to the overall difference.
As a more extreme example, imagine what the graph would look like if the x-axis were the cost of the house. The data would look even more squished; the difference in the number of rooms would be even less relevant because the cost of two houses could have a difference of thousands of dollars.
The goal of normalization is to make every data point have the same scale, so that each feature is equally important. The image shows the same house data normalized using min-max normalization:
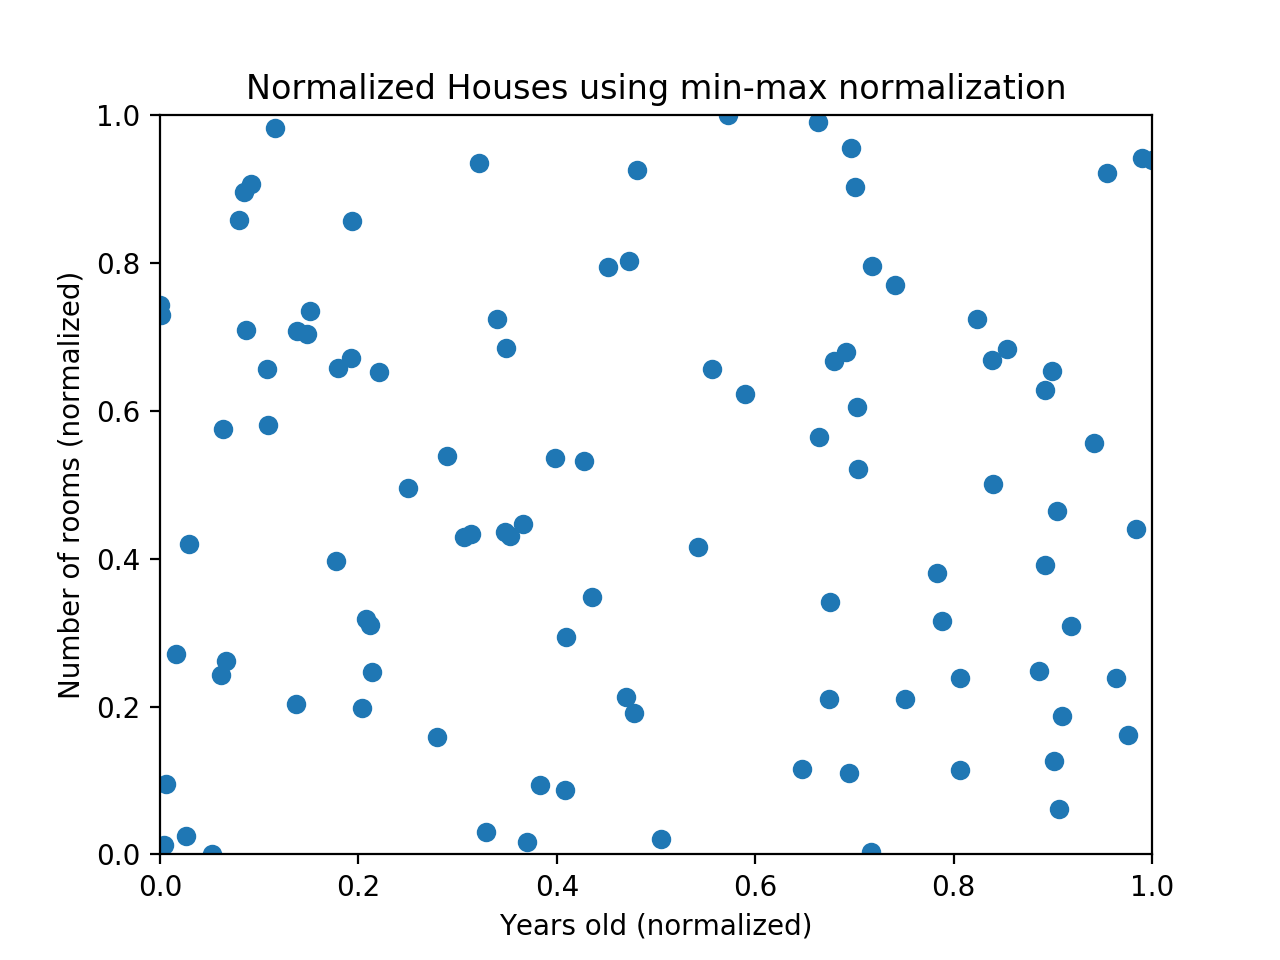
A min-max normalization example where data points on the y-axis range from 0 to 1 and data points on the x-axis range from 0 to 1
Knowing why we normalize data is crucial, but timing also matters. Let’s see when to normalize data during a typical workflow.
When to normalize data?
We usually normalize data:
- Before training: Especially with ML models that use distance metrics or gradient-based optimization.
- After splitting: Apply normalization after splitting data into train and test sets to avoid data leakage.
- Before clustering: These techniques are sensitive to feature magnitude.
In contrast, we don’t need to normalize if we’re using tree-based models likeDecision Trees, Random Forests, or Gradient Boosted Trees, which are scale-invariant.
Conclusion
Learning how to normalize data is essential for successful machine learning projects. This guide showed you practical methods for normalizing data using both min-max and z-score techniques. By following these step-by-step approaches, you can ensure your features contribute equally to model training, leading to better performance and more reliable predictions.
If you want to expand your knowledge of machine learning, check out theMachine Learning/AI Engineercourse on Codecademy.
Frequently asked questions
1. What is mean normalization in ML?
Mean normalization is a technique where data is adjusted so that its mean becomes zero. The mean normalization formula is:
value−meanmax−min\frac{value - mean}{max - min}
max−minvalue−meanThis method is a hybrid between min-max normalization and z-score normalization, helping to center the data around 0 while also scaling it based on the range. It’s used in some machine learning applications where centering data helps improve convergence.
2. What are the rules of normalization?
The general rules for normalizing data include:
- Use min-max normalization for bounded features or neural networks
- Use z-score normalization when the data contains outliers
- Always fit normalization parameters (mean, std, min, max) only on training data
- Apply the same transformation to test and validation sets
- Don’t normalize categorical variables—encode them instead
3. What are the benefits of the normalizing process?
The main benefits of normalizing data include:
- Improved algorithm performance and accuracy
- Faster convergence in optimization algorithms
- Equal contribution of features regardless of their original scale
- Better distance-based comparison (e.g., in k-NN, SVM, or clustering)
- More stable and interpretable results
4. What happens when data is not normalized?
When data is not normalized:
- Features with larger scales dominate those with smaller scales
- Distance-based algorithms produce biased results
- Training times increase, and convergence may become unstable
- Model predictions may become inaccurate or inconsistent
5. Is normalization necessary?
Normalization is necessary when:
- You’re working with models that rely on distance (k-NN, SVM, clustering) or gradient-based learning (neural networks, logistic regression)
- Your dataset features have different ranges or units
However, for tree-based algorithms like Decision Trees or Random Forests, normalization is not strictly required as they are scale-invariant.
'The Codecademy Team, composed of experienced educators and tech experts, is dedicated to making tech skills accessible to all. We empower learners worldwide with expert-reviewed content that develops and enhances the technical skills needed to advance and succeed in their careers.'
Complete Payment to Unlock Full Guide & Source Code
You are viewing the 30% preview. Join TopCourseAI Pro to unlock the remaining 70% of this article, unblur all code snippets, and gain full access to all 412 technical projects and guides.
Ready to access the complete step-by-step tutorial?
Gain full unhindered access to all 412 technical projects and guides, unblur all source code snippets, and download runnable scripts.
Nano Banana Pro Tutorial: Create & Edit Images
Next BlueprintOpenAI's Codex App for macOS: Setup, Features & First Project
Related Project Guides
View all 412 →Decision Trees for Classification and Regression
Decision trees are a common type of machine learning model used for binary classification tasks. The natural structure of a binary tree lends itself well to predicting a “yes” or “no” target. It is traversed sequentially...
Machine learningFeature Importance
When we fit a supervised machine learning (ML) model, we often want to understand which features are most associated with our outcome of interest. Features that are highly associated with the outcome are considered more...
Machine learningHistory of Chatbots
In October of 1950, Alan Turing proposed an approach for evaluating a computer’s intelligence and famously named his method, The Imitation Game. The premise is that an interrogator talks to two people through a “typewrit...
Ready to start building your next project?
Enjoyed this guide? Continue exploring our library of 412+ step-by-step guides, starter files, and practical projects across Web Development, Mobile Apps, AI, and Design.